The best teams across 145 years of Test cricket - part two
A look at the teams with the longest, and most imposing, dominant streaks, and a comparison of the best Australia and West Indies teams
Anantha Narayanan
26-Jun-2021
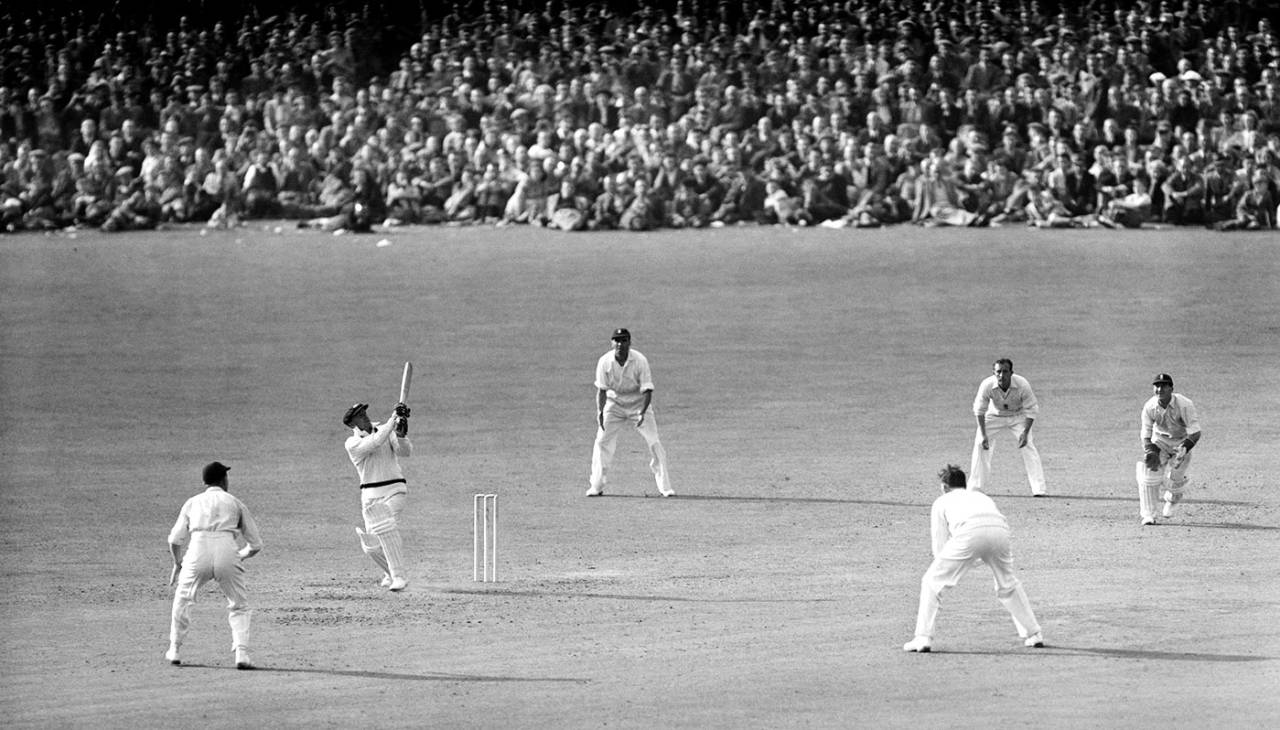
Which is the greater Australian team - Bradman's (above) Invincibles or Waugh and Ponting's side? • PA Photos/Getty Images
This is the second part of my two-part essay on rating Test teams. The first part covered Test cricket from 1877 to 1991 - which I divided into five periods. The explanations on the methodology are not repeated here. In this article, I will cover the next two periods, from 1992 to 2021 (including the recently concluded World Test Championship final), and provide details of various related analyses.
In this pair of articles, I have analysed and rated teams across 145 years of Test cricket. This is different to the ICC ratings. I consider the results, location, relative team strengths, relative team positions, and the nature of the win/draw/loss in each case. I have also introduced decay in the methodology so that recent matches carry more weight.
If you have not read part one yet, it is time read that article first. Otherwise, this article will not make any sense to you.
Let us first look at the 15-year period that includes the birth of the current millennium.
We saw in the first article that in the team standings as on December 31, 1991, West Indies were on top with 631 TRI points, but Australia had almost drawn level - they were just a point behind. The era of West Indian domination was about to end. Barring a blip during 1994, when Pakistan led the standings, Australia finished on top with 14 first places in this 1992-2006 period, and in four more years in the next one.
It was not just that Australia led the table; they did it in style. In the 14 years in which they topped the table, they had an average TRI value of 749. The average of the 14 second-placed teams' TRI values was 662. This shows that Australia had an average lead of 87 points, or nearly 15%. That is a massive level of domination. If we narrow this down to 2000-2009, this gap is a huge 143 TRI points on average. This was exceeded only by the Australian teams of the 1940s and '50s. Initially it was Allan Border who led the team in this phase, then Mark Taylor, followed by Steve Waugh.
Among the who took Australia to their lofty heights and kept them there is a who's who of Australian cricket. In no particular order - Taylor, Michael Slater, Matthew Hayden, Ricky Ponting, Steve Waugh, Mark Waugh, Michael Clarke, Ian Healy, Adam Gilchrist, Shane Warne, Glenn McGrath, Brett Lee, Jason Gillespie. Pakistan's lone success, in 1994, was built around Imran Khan, Javed Miandad, Inzamam-ul-Haq, Wasim Akram and Waqar Younis. However, the team that made ripples was South Africa, who re-entered the Test scene in 1992 and had a string of second- or third-place finishes from 1995 through 2004. England, who had an average start, ended the period strongly.
In the 15 years between 2007 and 2021, three teams dominated. Australia led during the first four years, South Africa topped for three years, and India finished the period well with five consecutive No. 1 placings. England took the top spot once, Australia managed another as well, while New Zealand ended the period with the WTC title and the No. 1 ranking.
Ricky Ponting took over as Australia's captain in 2004 and he was assisted by Michael Clarke, Michael Hussey and Mitchell Johnson. Warne, McGrath and Gilchrist left at the beginning of this period. Australia did not feel their absence immediately. But as years passed, their dominance waned. South Africa were the team to beat. Led very well by Graeme Smith, they had Jacques Kallis, Hashim Amla, Dale Steyn, AB de Villiers and Vernon Philander. They were on top for three years between 2012 and 2014. Australia had a one-year stint at the top in 2015, thanks to the efforts of the likes of Nathan Lyon and Pat Cummins.
Then India took over and they ruled the roost for the next five years. Led by Virat Kohli, India have had R Ashwin, Ravindra Jadeja, Cheteshwar Pujara, Ajinkya Rahane, Ishant Sharma, and recently Rishabh Pant and Jasprit Bumrah in their ranks. The series win in Australia last season was crucial, as they would have lost the top ranking had they not won there.
New Zealand's away series win in England, just before the WTC final, narrowed the gap with India. Kyle Williamson, Ross Taylor, Tom Latham and their world-class pace bowlers provided them a strong base. They followed this with their excellent win in the WTC final and have overtaken India in the ratings. It is clear that New Zealand and India are the two best teams playing now.
Exactly 100 year-end ratings have been calculated in this exercise. Of these, the first 25 belonged to the pre-WWII years, when it was virtually a two-horse race. As such, it is not worthwhile including those years in the summaries. So the table above covers only the years from 1946 to 2021. By 1950, West Indies and South Africa were becoming stronger and Pakistan entered with a bang. Hence one can say that there was strong competition from the end of World War II.
In the 75 year-end calculations after World War II, Australia led in 36 - nearly half of all years in this period. West Indies led in 16 year-end tables and shared the lead in one. England led in 11, and India in five. South Africa topped the table in four (of the 58 tables in which they were present) and Pakistan finished with 1.5. New Zealand managed to post one entry with their takeover of the 2021 table (as on June 24).
Australia's domination has been phenomenal. For them, this 75-year period started with Don Bradman and ended with Steven Smith, the top two batters in terms of batting average (with a 1500-run cut-off). I would venture to say that this domination is akin to that of Bradman over other batters. Add to this the fact that Australia have 25 second- and third-place finishes, which means that only 14 times did they drop out of the top three positions.
West Indies started becoming a force once the three Ws emerged. They were followed by Garry Sobers, then Clive Lloyd and a galaxy of magnificent pace bowlers. Brian Lara was on the scene towards the end of West Indies' period of dominance, but unfortunately he had to preside over their subsequent decline. However, the last 20 years do not take anything away from the glittering three decades during which West Indies reached the top 16 (and a half) times. They were second an equal number of times.
England were there or thereabouts right through this 75-year period, but they never had a really great sustained run. Possibly their best stretch was between 1968 and 1980, when they led the table seven times. Ian Botham, Geoffrey Boycott, Bob Willis, Derek Underwood and Alan Knott formed the core of this team.
These trends are mostly mirrored when we look at the leaders at the Test-match level. A total of 2150 Tests have been played from 1946 through the WTC final in 2021. Five teams were rated in all these Tests. Australia led in 1037, just short of 50%. West Indies in around 22%, and South Africa, England and India shared the bulk of the remaining Tests. Pakistan led in 72 tables. New Zealand led in four tables, in 2021: at the end of England's Test in Chennai this year, after West Indies' win in Dhaka, and after the two most recent Tests (West Indies vs South Africa, and the WTC final).
Australia's highest TRI value, 919, was reached in February 1951. West Indies reached theirs, 856, on October 15, 1986. England's peak of 868 points was way back in 1889.
Australia have averaged a score of 646 across all the matches they played. England's average is 541. West Indies, pulled down considerably over the past 25 years, and India, weighed down by those unproductive early decades, now have virtually identical averages. Pakistan and South Africa have performed well overall, crossing 500 TRI points on average.
Team Graphs
Presenting all eight teams in one graph would have been very cluttered, so the four best teams in terms of number of year-end top ranks - Australia, West Indies, England and India - are shown in one graph, and the other four in another. In view of the chalk-and-cheese nature of the teams competing and their strengths, the four major teams of the pre-WWII years are shown in one graph, while the 1947-to-2021 period is depicted in two. Only the year-end values are plotted.
Presenting all eight teams in one graph would have been very cluttered, so the four best teams in terms of number of year-end top ranks - Australia, West Indies, England and India - are shown in one graph, and the other four in another. In view of the chalk-and-cheese nature of the teams competing and their strengths, the four major teams of the pre-WWII years are shown in one graph, while the 1947-to-2021 period is depicted in two. Only the year-end values are plotted.
The first of these graphs portrays the post-World-War scene very nicely. The pre-eminence of Australia immediately after the war, followed by periods of good performance, the slump in the 1980s, and the dominance either side of the turn of the millennium. The gradual rise of West Indies is captured as well, culminating in their glory days in the 1980s and a free fall afterwards. England have had their peaks here and there but no sustained superlative period. India have been the dominant team recently with five successive No. 1 finishes from 2016 through 2020.
The second of these graphs is equally illuminating. The rise to lofty heights of South Africa in the early 1950s and then again in the late '60s, followed by their banishment, and then their return and rise to the top again a few years after the millennium and in the first half of the last decade. Pakistan's intermittent rise to the top and their recent middling positions are reflected. Also the way New Zealand have moved to the top, and how they were second to West Indies in the 1980s. Finally, Sri Lanka have made some game attempts to move to the top, and achieved good placements in the mid-2000s.
The graph for the first period of Test cricket is dominated by England and Australia (note the huge gap between the two sides in the late 1880s, though). The graph also illustrates the rise to the top of Australia after the First World War, their plunge in the 1920s and subsequent sharp rise again.
The top TRI values
The 850-mark has been breached 98 times in the history of Test cricket: twice by England in 1889, when they had a run of six wins against Australia; five times by West Indies in 1986; and a whopping 91 times by Australia. The post-war Australians breached the mark 36 times between 1949 and 1952. This included five occasions when they crossed 900 and one of these resulted in the highest TRI ever reached, 919, in February 1951. The other great Australian team achieved the 850-mark no fewer than 55 times between 2003 and 2008. This included two instances when they crossed 900. The highest they reached was 913.
The 850-mark has been breached 98 times in the history of Test cricket: twice by England in 1889, when they had a run of six wins against Australia; five times by West Indies in 1986; and a whopping 91 times by Australia. The post-war Australians breached the mark 36 times between 1949 and 1952. This included five occasions when they crossed 900 and one of these resulted in the highest TRI ever reached, 919, in February 1951. The other great Australian team achieved the 850-mark no fewer than 55 times between 2003 and 2008. This included two instances when they crossed 900. The highest they reached was 913.
The most dominant teams
Now we come to the most important part of this exercise: determining the greatest Test team in history by assessing dominance across long periods.
Now we come to the most important part of this exercise: determining the greatest Test team in history by assessing dominance across long periods.
The first table is a strictly defined one. I have looked for team streaks in which the teams exceeded 800 TRI points. I have identified three such streaks. (England are the only other team to have ever crossed 800, and that streak was just three Tests long, so they have been left out of the graph above.) Let us now regard the three dominant streaks individually. Note that if a team had consecutive identical values, only the first occurrence is shown.
At the end of the Ashes Test played at Trent Bridge in 1948, Australia reached 846 TRI points. They maintained a level of over 800 TRI points for the next 66 Tests. The streak ended with the drawn Test in Adelaide against South Africa in 1953. A home loss in the next Test took them to 765 TRI points. Their average TRI over this span was an imposing 864. Their high average TRI indicates how far ahead of the others Australia were during this dominant phase. It can be noted that of these 66, 54 values are above 850.
West Indies reached 800 during a Test in which they did not play, in 1985. Their TRI value was 801. They stayed above 800 during the next 57 Tests, and averaging 822, and reaching a high of 856 in October 1986. During most of these Tests, New Zealand were in second place, though well over 250 points behind.
The third and most impressive of these dominant streaks was the six-year supremacy of Australia between 2002 and 2008. On 28 July 2002, they went past 800 TRI points during a Test between Sri Lanka and Bangladesh, and they stayed above 800 for the next 280 Tests. It is a fact that this number is higher than it would have been in previous eras because more Tests are being played these days, but it is still an amazing period of total domination. Australia reached a peak of 913 TRI points in January 2008, and they averaged 850 TRI points during this six-year period. It was the loss in Nagpur during their 2008 tour of India that got them below 800 and broke the streak (though they regained the 800 mark a couple of Tests later). They went past 850 on 142 occasions during that streak.
This table is a variant of the graph above it (with a massive basic difference). For each Test for each team, I have looked at every Test played in the period from seven to 12 years before that match and computed the average TRI value. I have then determined the highest TRI average for that team for that Test and selected the three greatest team periods ever on that basis. The lower limit of seven years is to make sure that the period considered is long enough to be of relevance. The upper limit of 12 years is to make sure that the core players are there at either end of each period.
Again, there were periods for three teams with TRI averages that exceeded 750 points and have been taken for further consideration. Australia 1, between 1946 and 1953; West Indies between 1983 and 1991; and finally, Australia 2 between 2001 and 2009.
The best Test teams ever
The West Indies team from 1983 to 1991 really does not have the numbers to be in contention for the title of the best team ever. There is no doubt that they had a long unbeaten streak, but the many draws, both in Tests and series, worked against them.
The West Indies team from 1983 to 1991 really does not have the numbers to be in contention for the title of the best team ever. There is no doubt that they had a long unbeaten streak, but the many draws, both in Tests and series, worked against them.
That leaves us with the two Australian teams. Australia 1 was outstanding, with an average TRI of 828. Australia 2 was equally impressive and secured an even higher average TRI of 842. So, round one to the recent Australian team.
However, the overall results favoured the earlier Australian team - 83.8% to 77.8%, a full six points. So, round two to Bradman and Lindsay Hassett's Australians. Does the fact that the Australia of Waugh and Ponting maintained the high numbers over a much bigger number of matches count? Probably not. The average number of Tests played per year in the 1950s was only around 15-20, against 40-50 in 2005. So that cannot really be a factor. What about the opposition? Australia 1 had England and an emerging West Indies and South Africa to contend with. Australia 2 had England, South Africa, India and Pakistan to contend with. Maybe a slight edge to Australia 2 in terms of competition.
Australia 1's more impressive team performance is enough to offset the slightly lower average TRI. And Australia 2's higher average TRI and the slightly higher quality of opposition are enough to offset their lower performance percentage.
I have to conclude that these two Australia teams were jointly the greatest to ever play Test cricket. Readers might have their preferences and justifications to favour one over the other, but as far as I am concerned, the two cannot be separated. This may not be the American way, in which there has to be a winner. However, this is not a single match. It is a complex collection of myriad factors and I am comfortable placing the two teams on the same pedestal.
A few observations
1. The highest ever TRI value reached was 919 by Australia in 1951, as mentioned earlier. The lowest TRI value for a team in top position was 549, for West Indies. All six teams were within 138 points of each other at this point, at the end of the Madras Test of 1982.
1. The highest ever TRI value reached was 919 by Australia in 1951, as mentioned earlier. The lowest TRI value for a team in top position was 549, for West Indies. All six teams were within 138 points of each other at this point, at the end of the Madras Test of 1982.
2. The highest TRI value for a team in second place was reached when the unfortunate South Africa team reached a magnificent total of 747 TRI points at the end of the Multan Test of 2003. South Africa had to contend with the immovable juggernaut of Australia who finished nearly 100 points ahead.
3. The biggest margin of difference achieved by a team that finished on top was by the magnificent Australian team led by Bradman in August 1948. Interestingly it was after Bradman's last Test, when Australia had 844 TRI points and England's tally was 387. If ever the numbers told a story, it was then, during those late summer days in England.
4. On four occasions, two teams finished with equal TRI points. One of these was a year-end rating and has already been covered. The four instances are: The Bombay Test of December 1978 when England and West Indies finished with 625 points. The December 1982 Karachi Test, and the Melbourne Ashes Test that same month, when West Indies and Pakistan finished with 570 points each. And India's 1992 Test in Zimbabwe, when Australia finished level with West Indies with 643 points. All four Tests feature West Indies. There are 18 instances when the two teams are separated by one point.
5. The average of TRI values for the top-placed teams for all 2424 Tests is 718. The average gap to second place is 113.
6. The average of top TRI values for the 100 year-end tables is 714. It is amazing how the numbers do seem to gravitate to certain values in a frequency distribution. The average gap to second place is 140. Possibly because the sample size is quite low.
7. The highest mean value of a single table was achieved recently at the end of Pakistan's Test in Harare in May 2021. The mean of the TRI values was a huge 537. The top four teams exceeded 600 points apiece.
8. At the other end, after the 1947 Christchurch Test featuring England, Australia's tally was 774 TRI points, England's 448 points, and the other teams had points just above 100. The mean was the lowest, a miserable 281.5.
9. Coming to standard deviation, the Test with teams bunched closest was the India-England Madras Test of 1982, already featured for the low first-placed score of West Indies. The TRI points for the six teams were 549, 519, 504, 473, 425 and 411. This leads to a very low standard deviation of 48.4 and an unbelievable coefficient of variation of 0.101. This is the lowest CoV among all Tests.
10. At the other end of the spectrum, after the Adelaide Ashes Test of 1951, Australia topped with the all-time high TRI of 919. West Indies secured 704, England 340, South Africa 178, India 178, and New Zealand 163. The standard deviation is a huge 292.0 and the CoV a somewhat high 0.701. However, the highest CoV is for the Christchurch Test of 1947. The low mean of 281.5 and a high standard deviation of 251.9 mean that the CoV is a whopping 0.895.
Email me your comments and I will respond. This email id is to be used only for sending in comments. Please note that readers whose emails are derogatory to the author or any player will be permanently blocked from sending any feedback in future.
Anantha Narayanan has written for ESPNcricinfo and CastrolCricket and worked with a number of companies on their cricket performance ratings-related systems